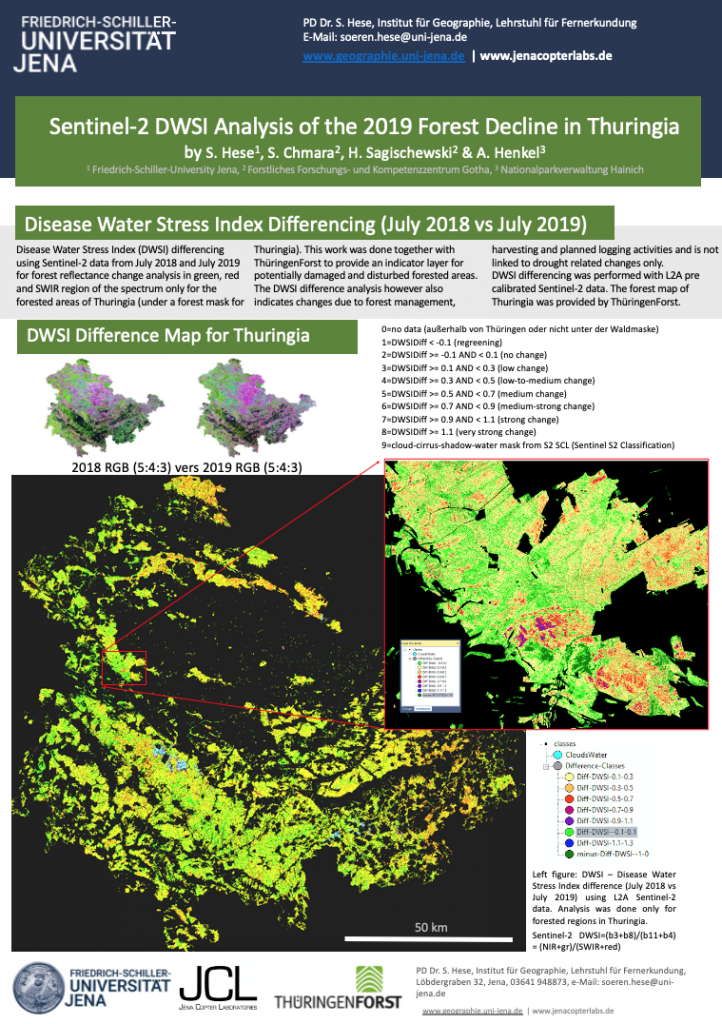
Beech Tree Mortality Analysis in the Hainich National Park Area – the Logbook
December 2020
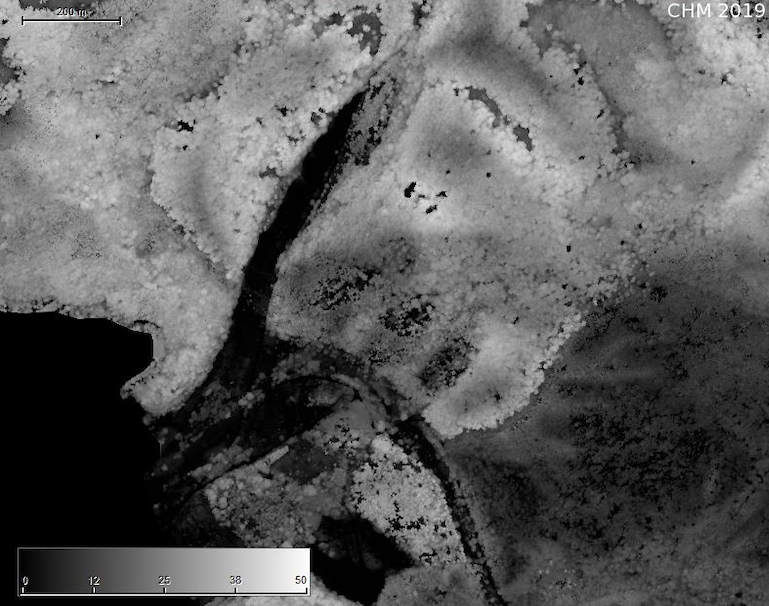
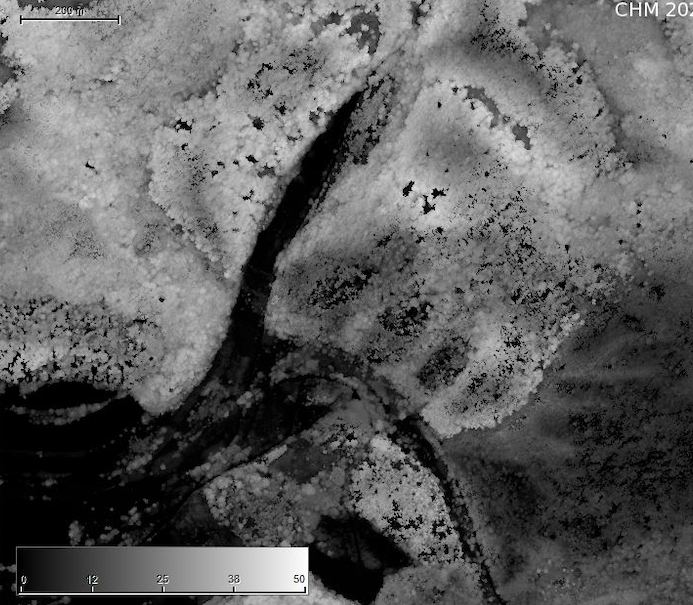
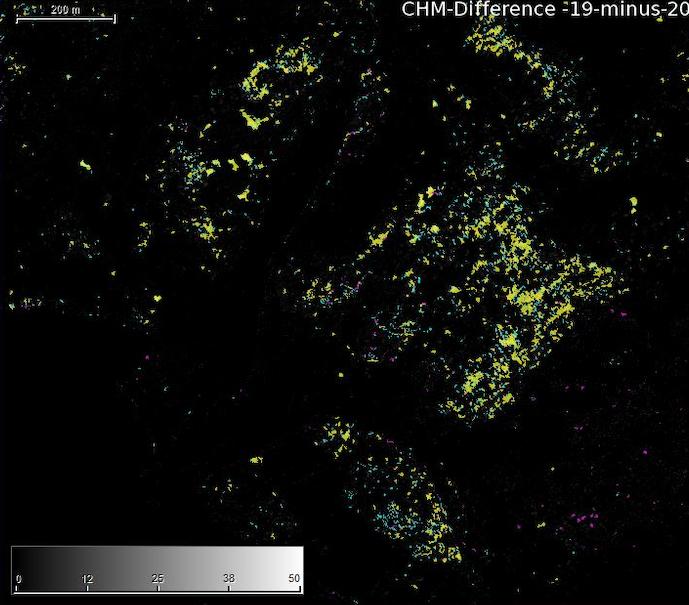
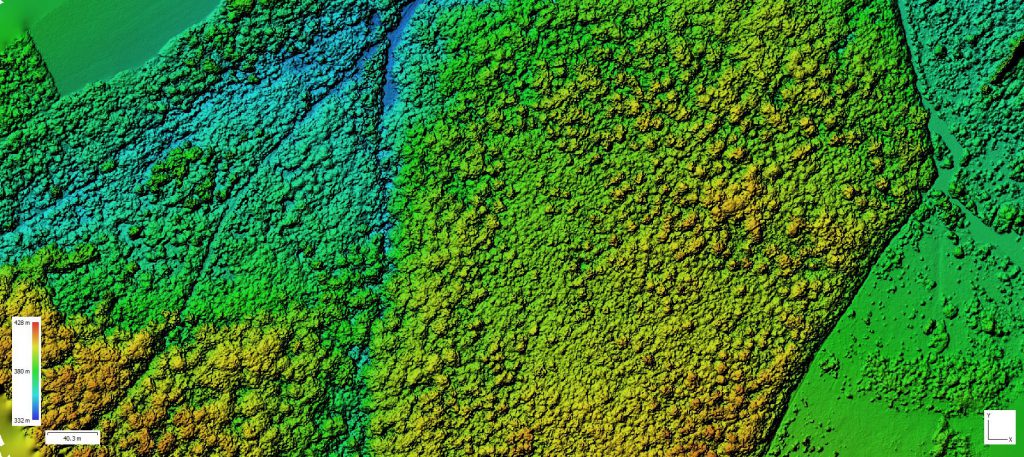
Update with data from the 2020 true ortho photo flight-campaign. These are preliminary results from the work for NLPV (the Hainich National Park Administration) to map the stand gap dynamics for the full national park area based on multitemporal canopy height model analysis (2018 vs 2019 vs 2020). More to follow – we are right now also finishing the deciduous tree damage mapping for the year 2020.
July 2020:
The planned reference flight campaign in July 2020 was postponed a few times – mainly due to the complex non-stable weather conditions in July. We never had a calm and stable high pressure weather situation for a few days. In fact it either was too cloudy or the 1/4 – 3/4 cloud coverage developed very quickly in the morning and results would have been patchy with a mix of cloud-shadow and sun illuminated shots. This usually creates an orthomosaic that is hardly usable for quantitative analysis.
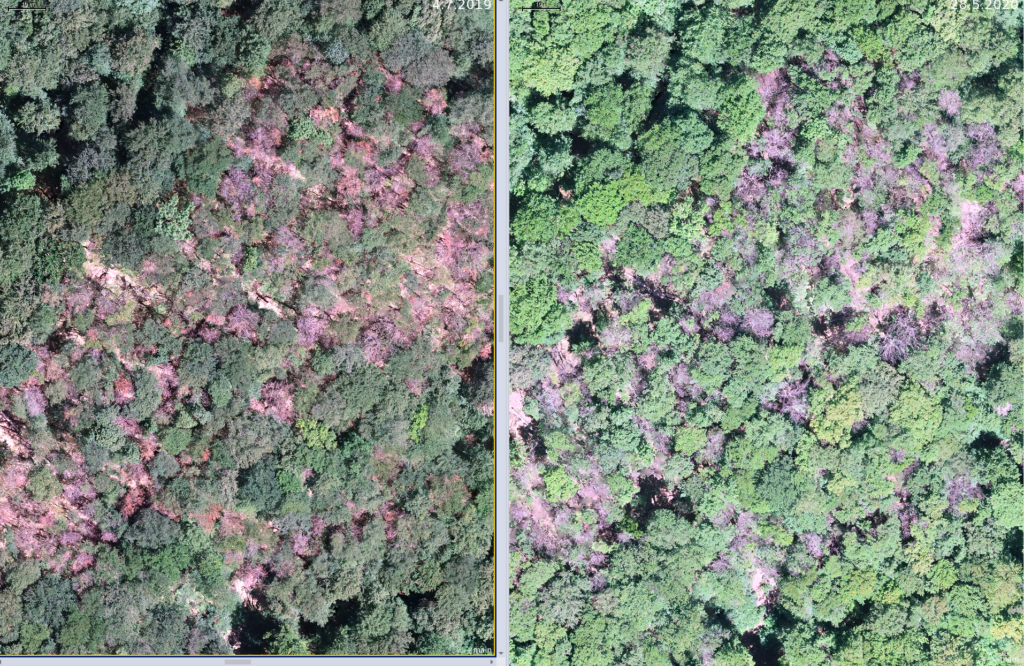
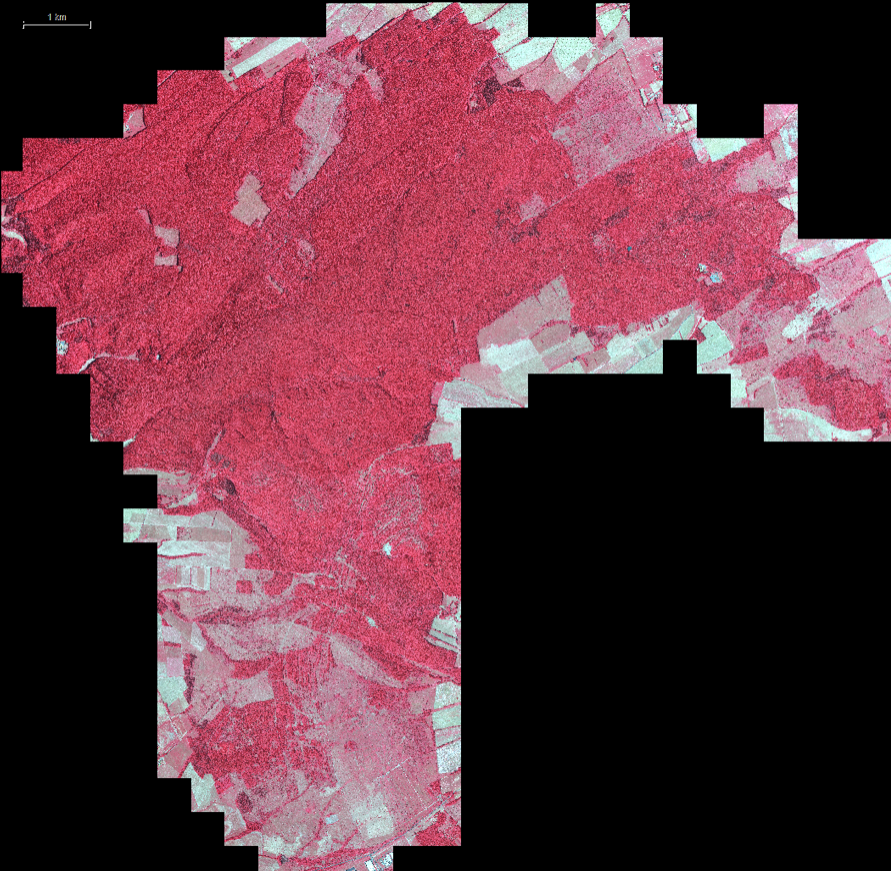
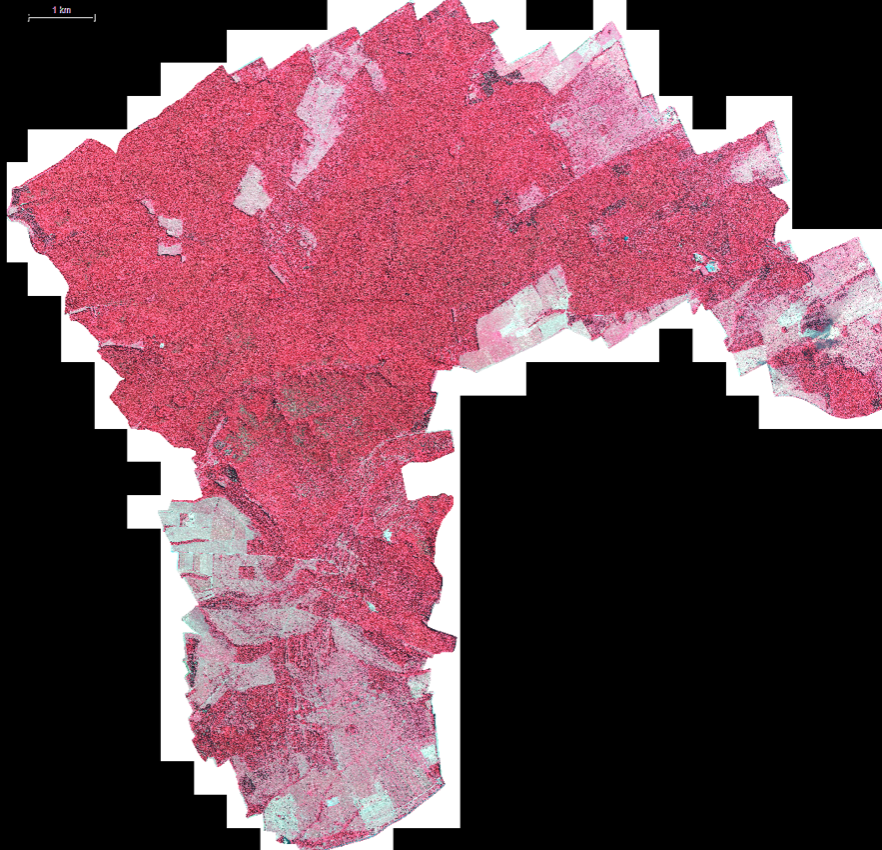
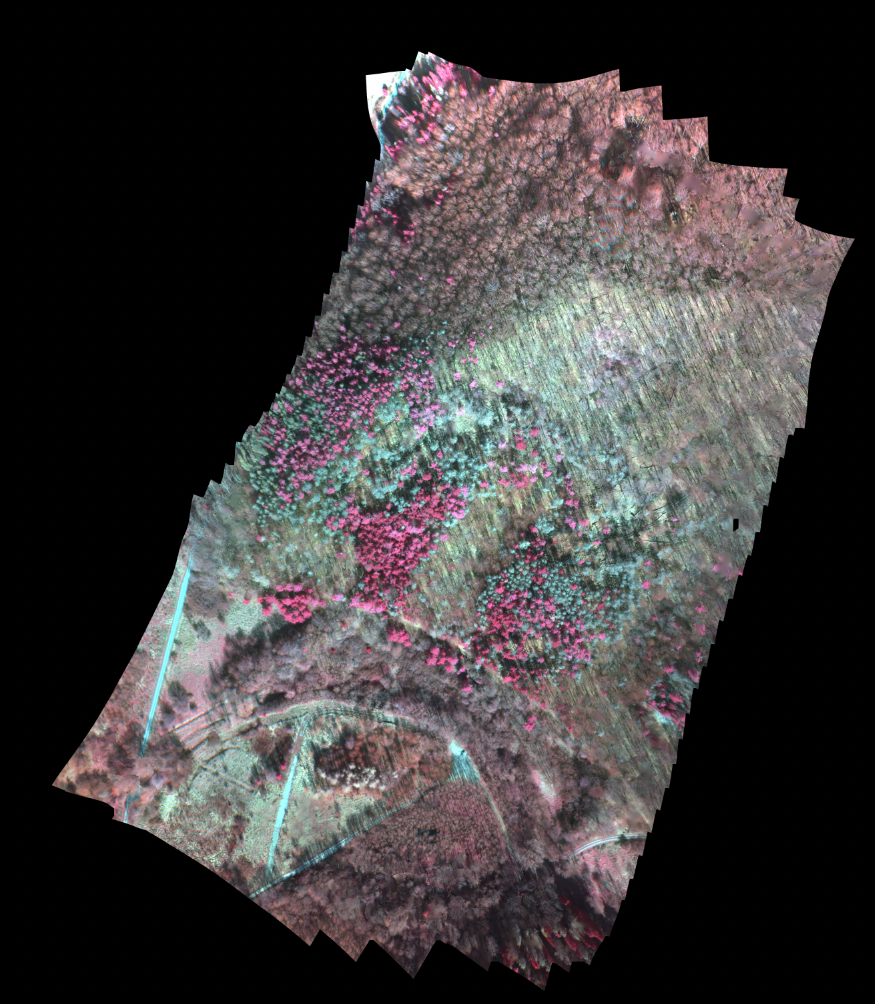
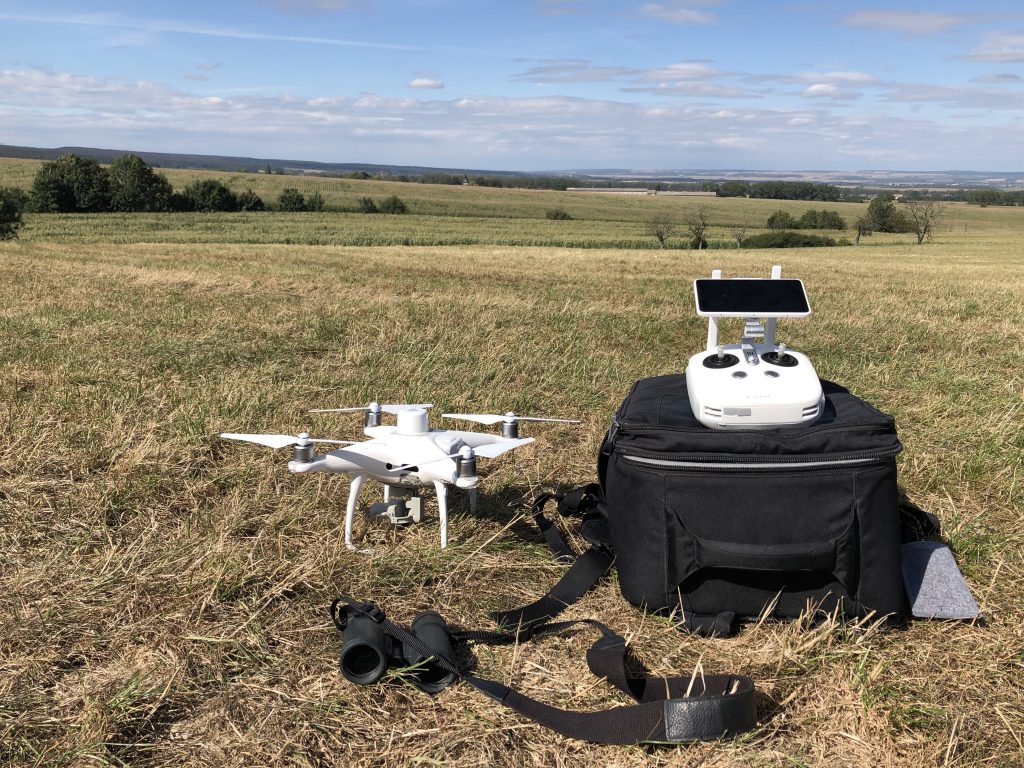
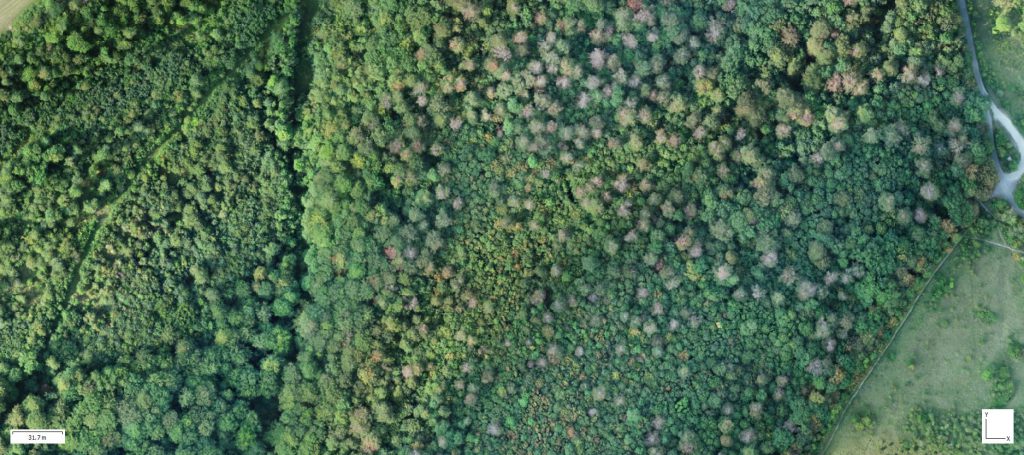
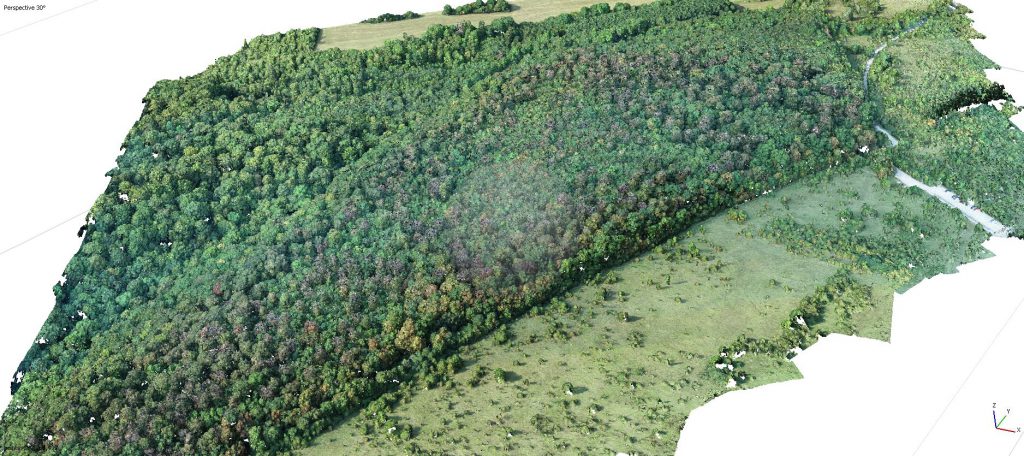
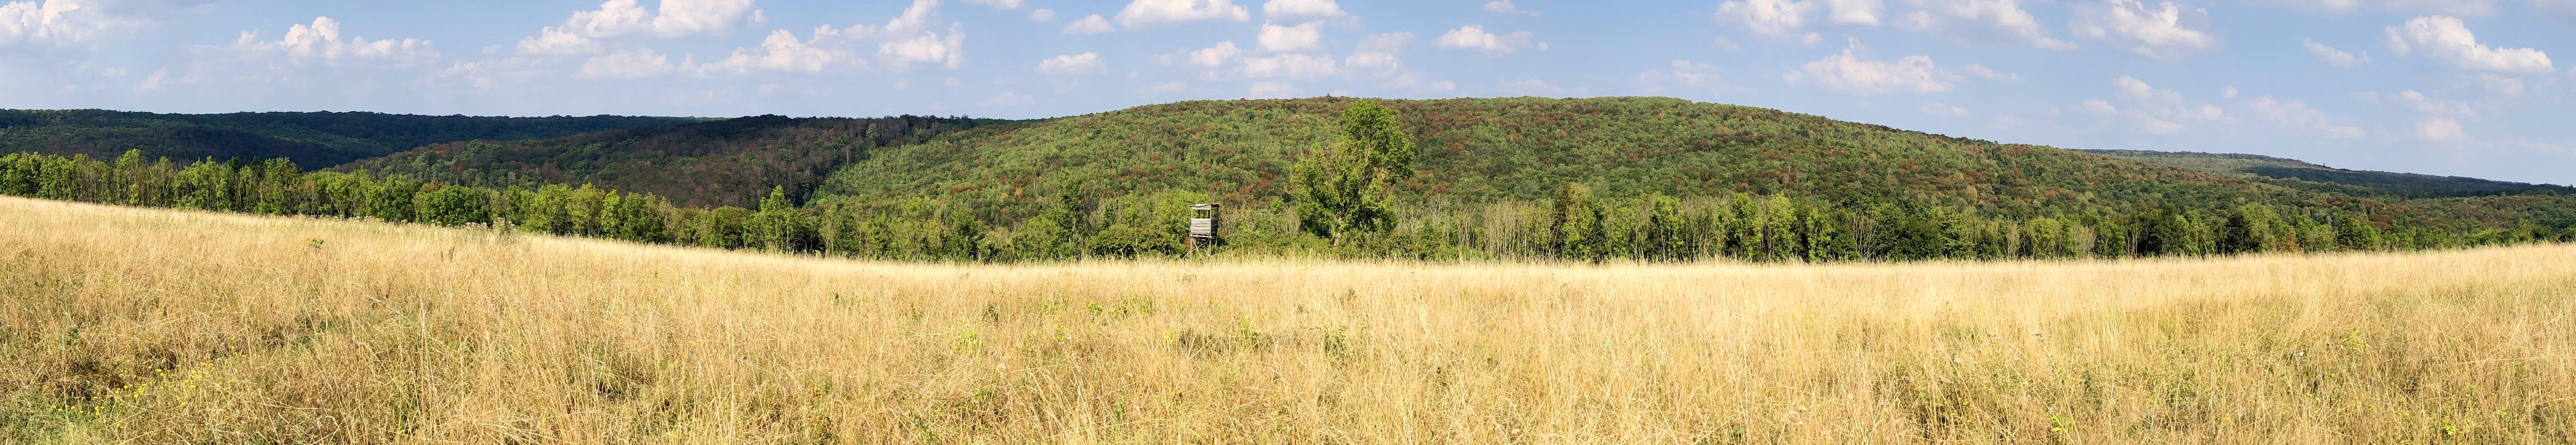
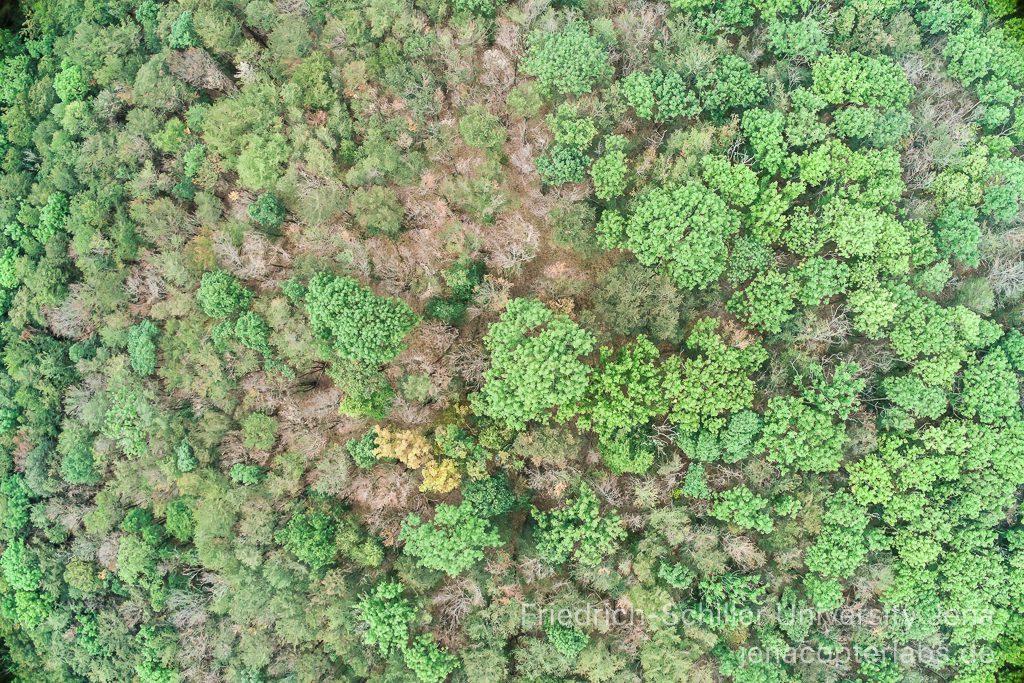
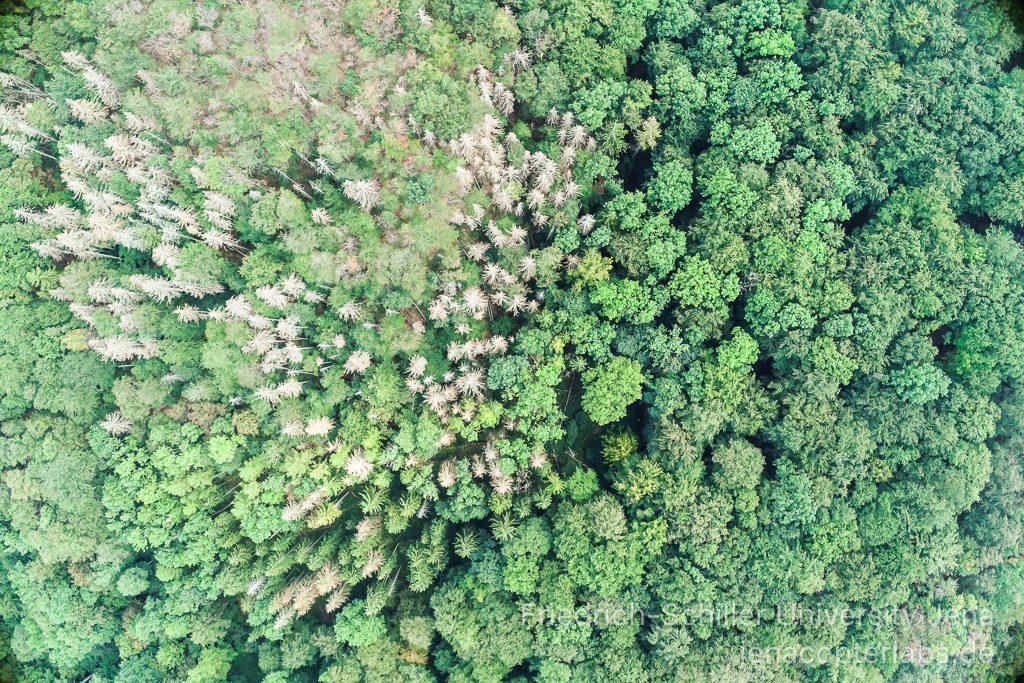
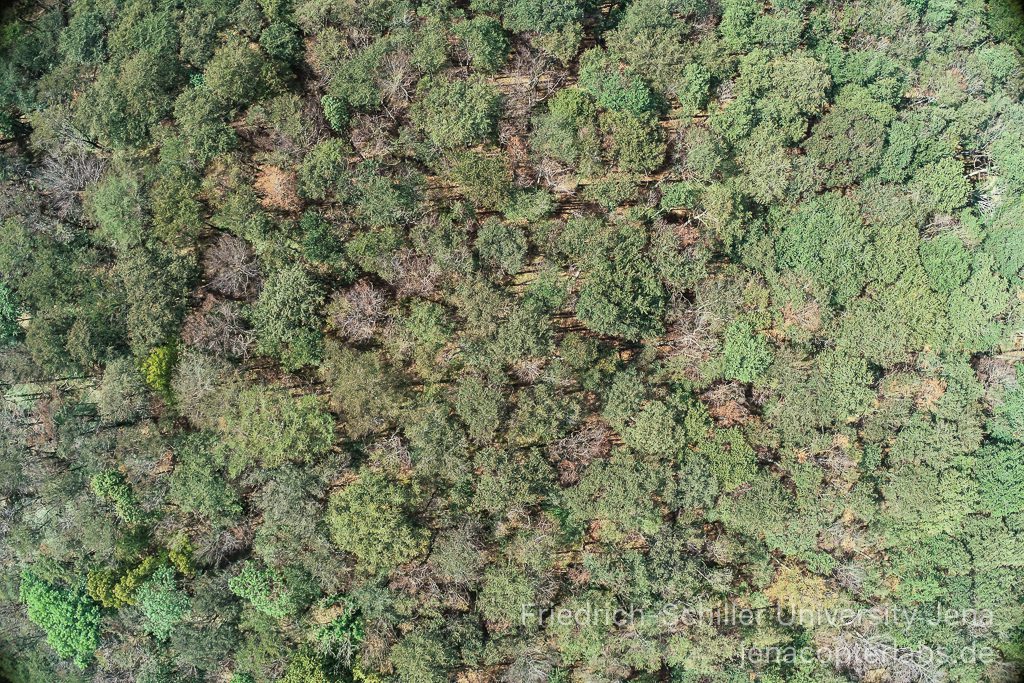
However – since July was moving day by day slowly towards August I decided to capture data anyway. Its nearly impossible to work with the spectral datasets that was generated but the surface models are always usable to map the newly developed (2020) stand gaps. So these snapshots are from the 23rd of July – already slightly within the decline towards the autumn reflectance of the forest canopy. The weather forecast gave 14 hours of sun but as all the days before – up from 10.30 AM small cirrocumulus developed and they quickly matured to at least 30% coverage. I covered the new Dachsberg site, Burgberg, Eichenberg and the Hegeberg site. Overall data for 400 ha was captured with the Phantom 4 RTK.
Visual comparison now clearly shows that at least on these testsites the beech tree decline slowed down considerable compared with the 2018 vs 2019 change that we mapped.
May 2020:
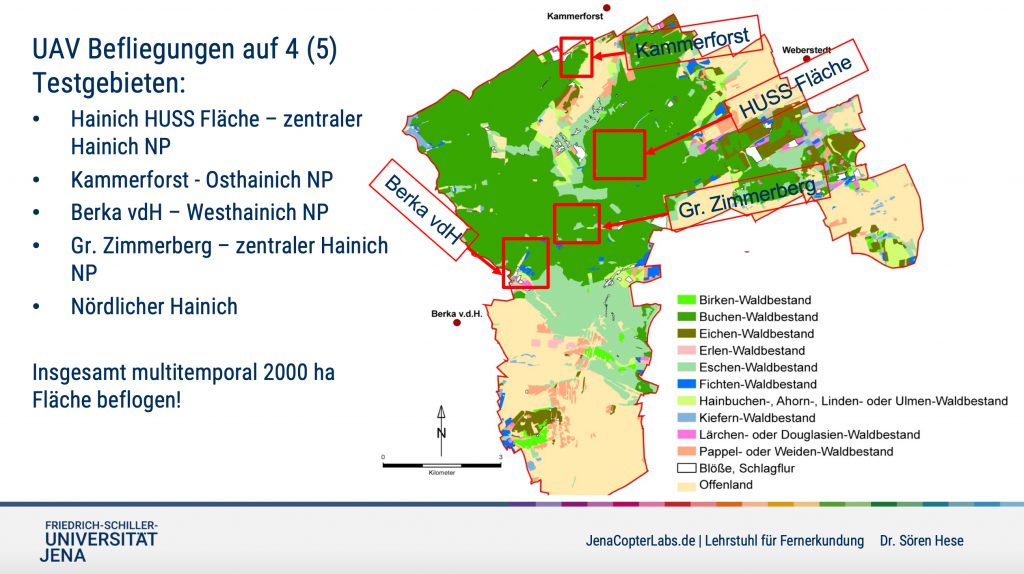
The first UAV flights of the vegetation period took place this year at the 28th of May. We covered the test areas East of Berka v.d.H. (Burgberg & Eichenberg) and parts of the Zimmerberg area. We also did flights over the region of Hegeberg in the North-East of the national park. Overall we did 14 flights (6 with the P4R and 8 with the P4M). SAPOS RTK fix was not always available at the Berka sites as usual but not a problem with the Hegeberg area. We also checked a new change hotspot in the North-West of the national park region (area close to the “Dachsberg”). Here we found some anomalies in S2 data from May and it seems that some defoliation occurred. UAV flights are planned here for end of June and line of sight seems to be ok from first flight plan models using GE and flight altitude of 100m above terrain.
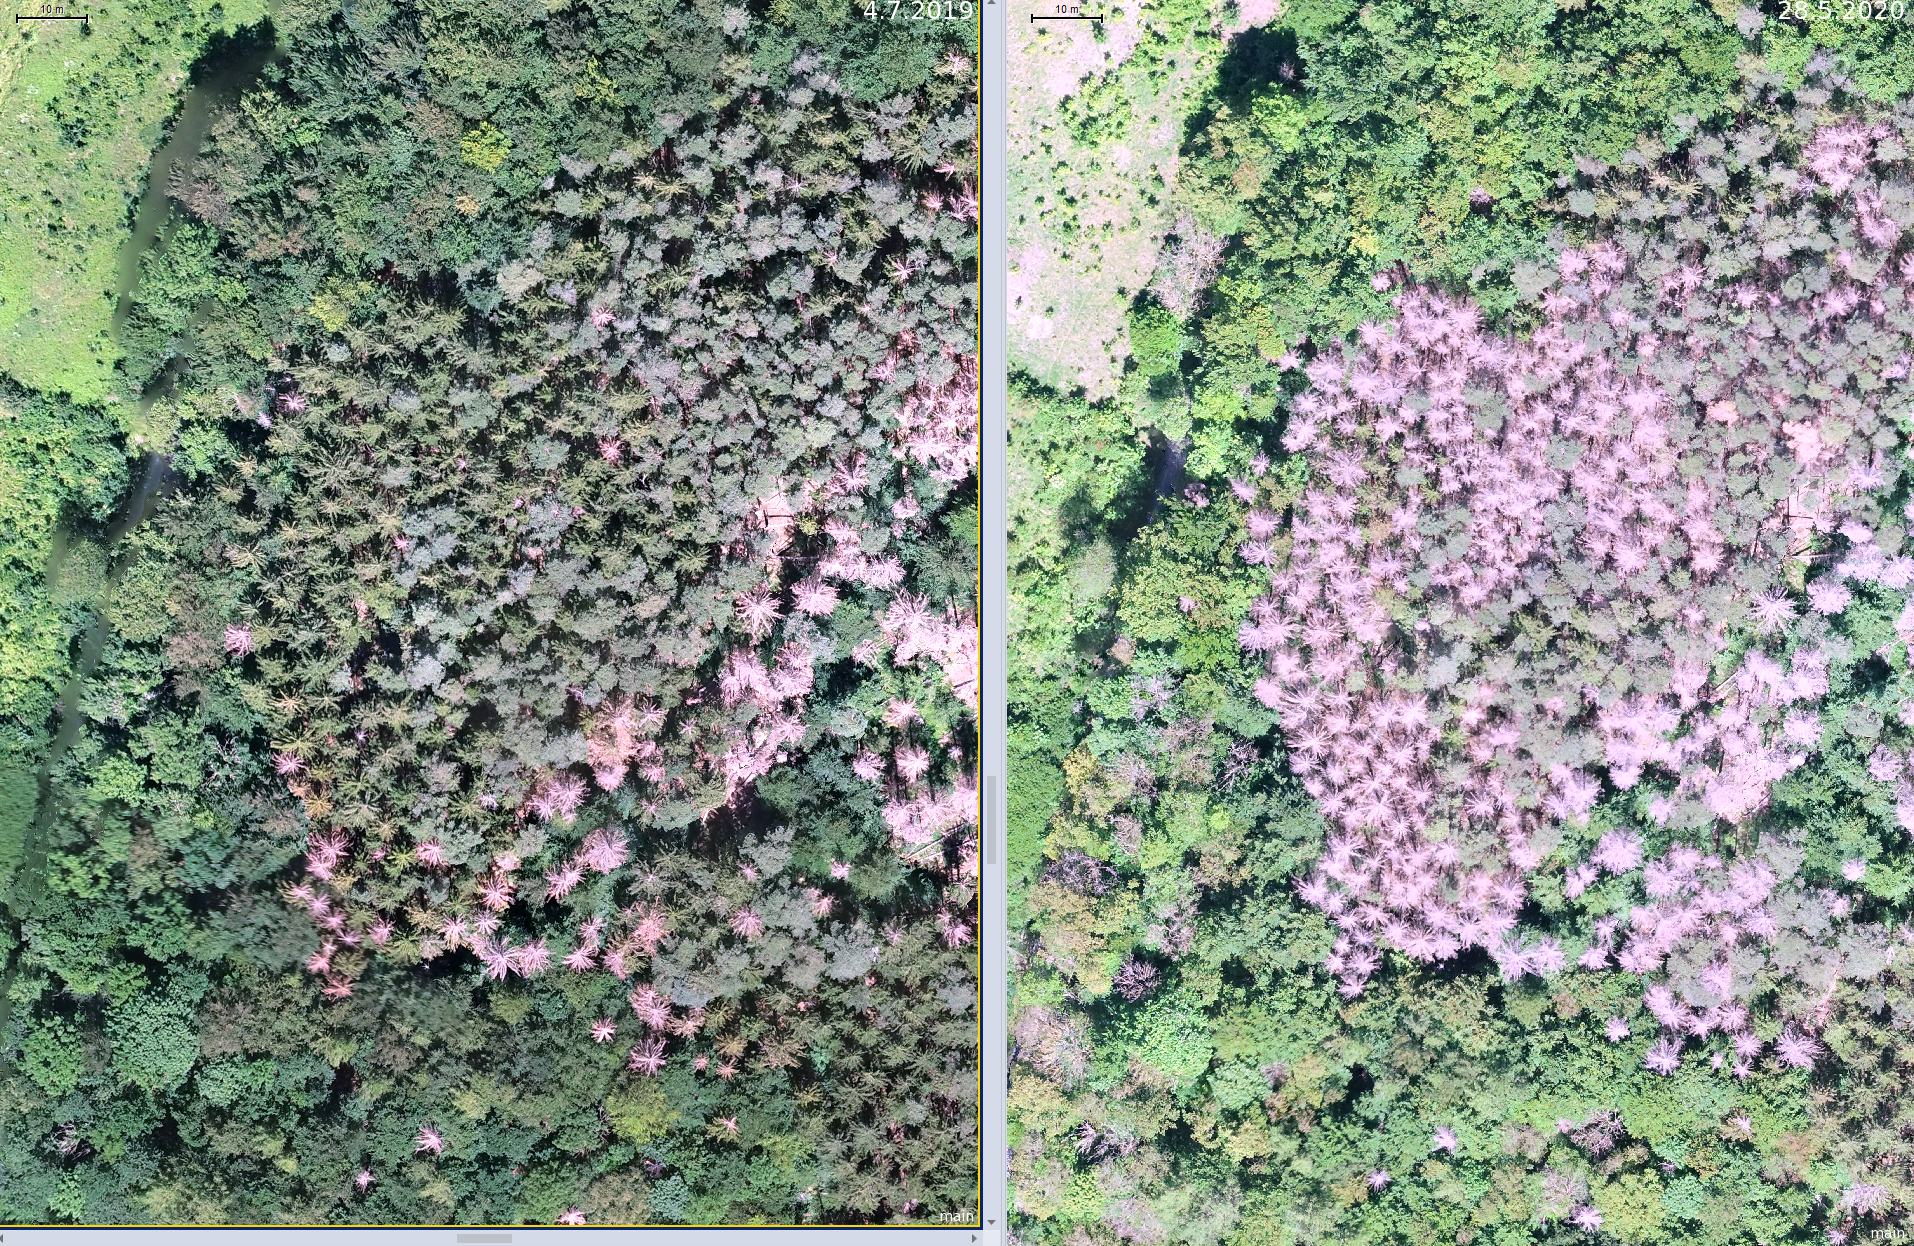
The dying of the spruce trees is not surprising but other areas show less changes in May (compared to July 5th) but we clearly have to evaluate the situation again end of June / beginning of July.
JenaCopterLabs Data Demo:
April 2020:
Planning for the May flight campaign is in full swing. The test sites will be extended in 2020. In the figure below an overview of the 2019 test areas from a presentation at DLR Bonn in 2019. We will extend this to areas in the northern Hainich.
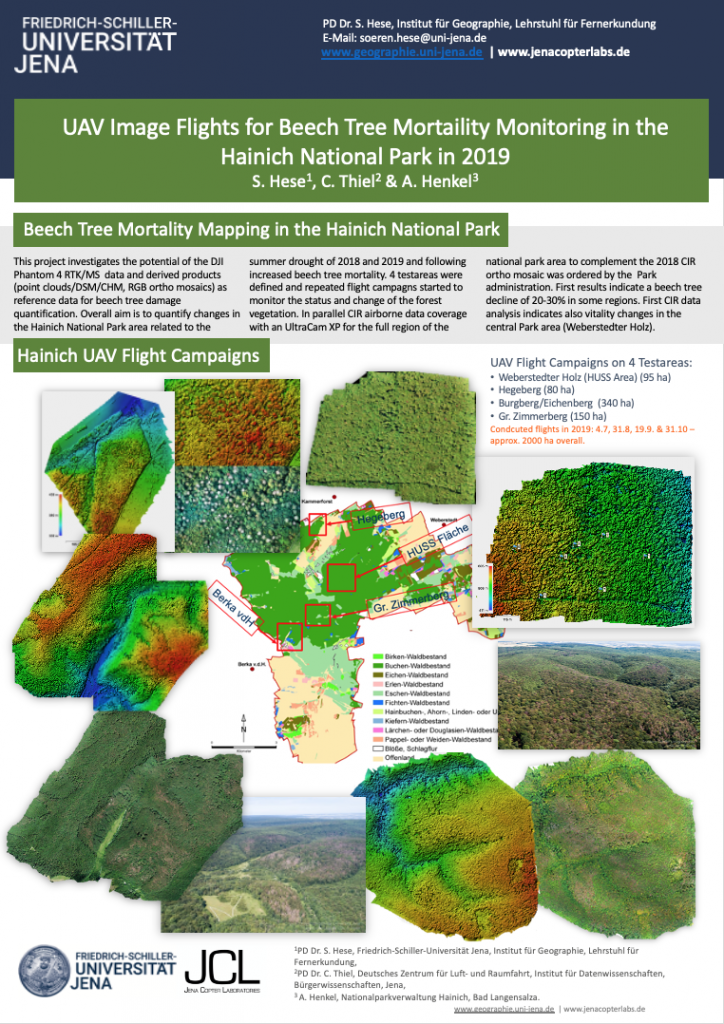
Quantitative analysis of the 2018 and 2019 CIR image data mosaic is nearly finished – we will publish results this year. This work individually delineated all crowns in the park region and classified 4 different damage categories. We also classified crown species using a supervised Convolutional Neural Network (CNN) training concept with reference data from field work in winter.
March 2020:
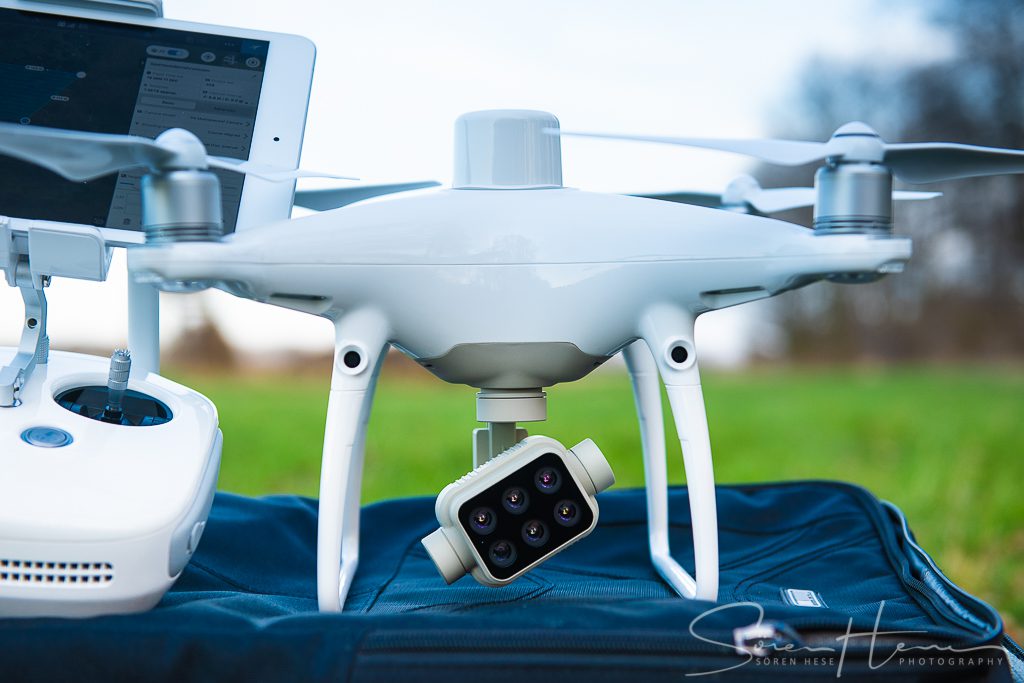
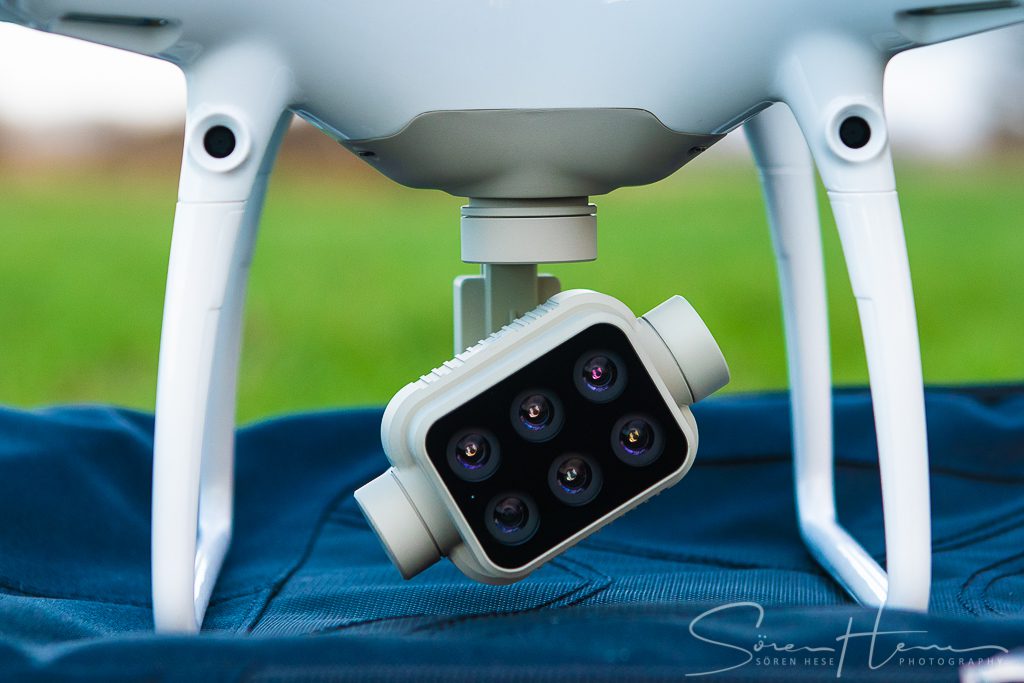
P4M (multispectral) tests in the Hainich National Park (Burgberg flights):
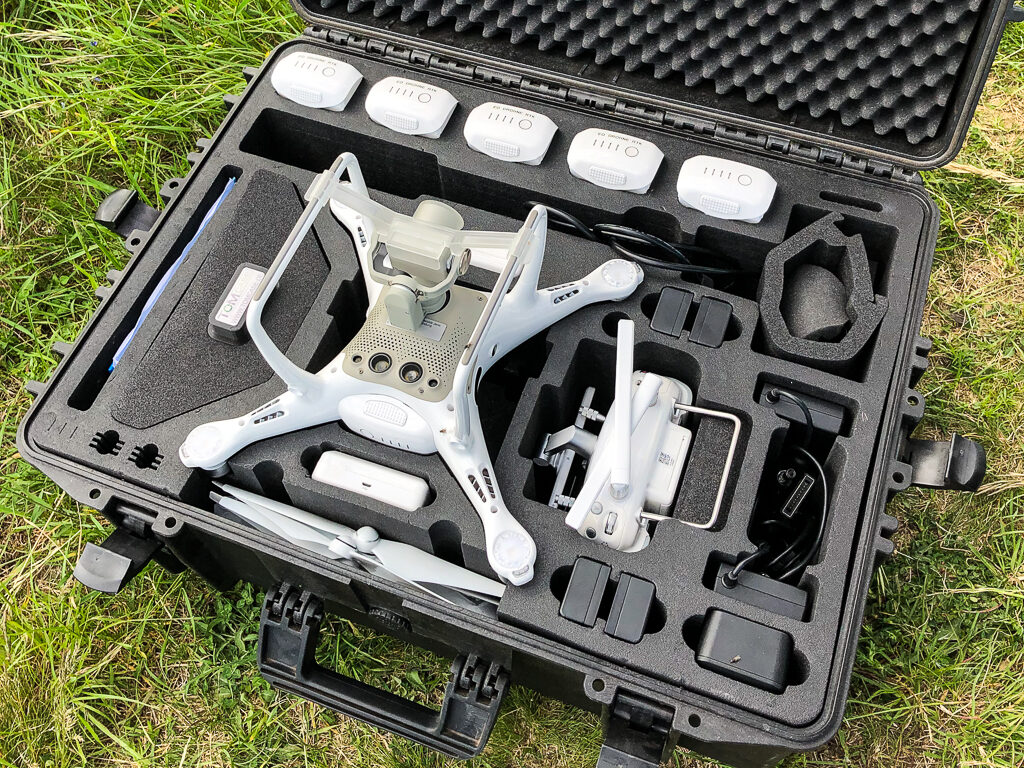
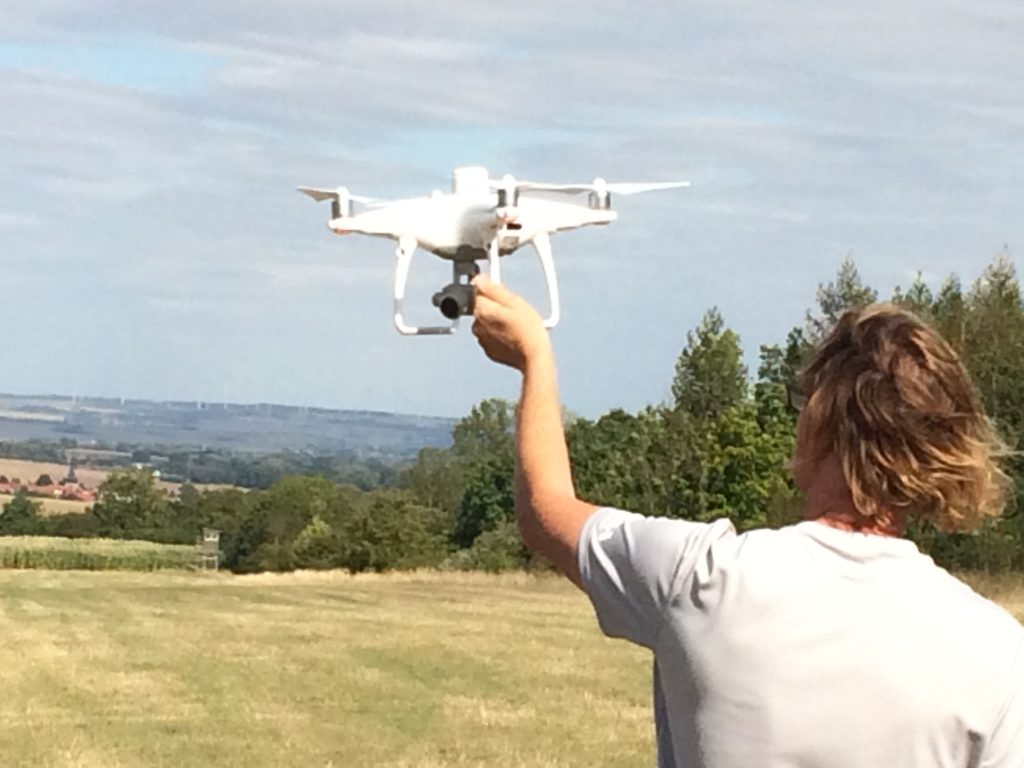
DJI did it again – the leading manufacturer of compact “of the shelve” drone solutions modified the Phantom 4 RTK and added a fully integrated multispectral camera. Those that are working with these (micro)multispectral camera systems on small UAV platforms couldnt really believe this news. DJI modified the Phantom 4 RTK (that turned out to be a game changer in some fields – notably surveying and precision change analysis in forest applications and vegetation change mapping) and now includes a 5 channel multispectral camera with additional RGB sensor.
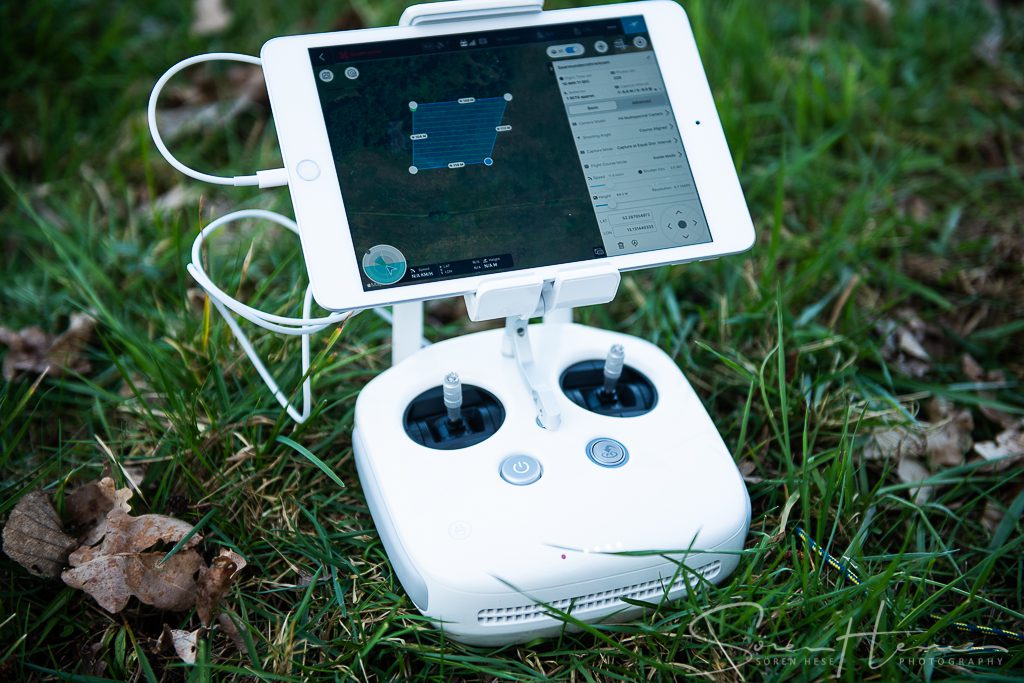
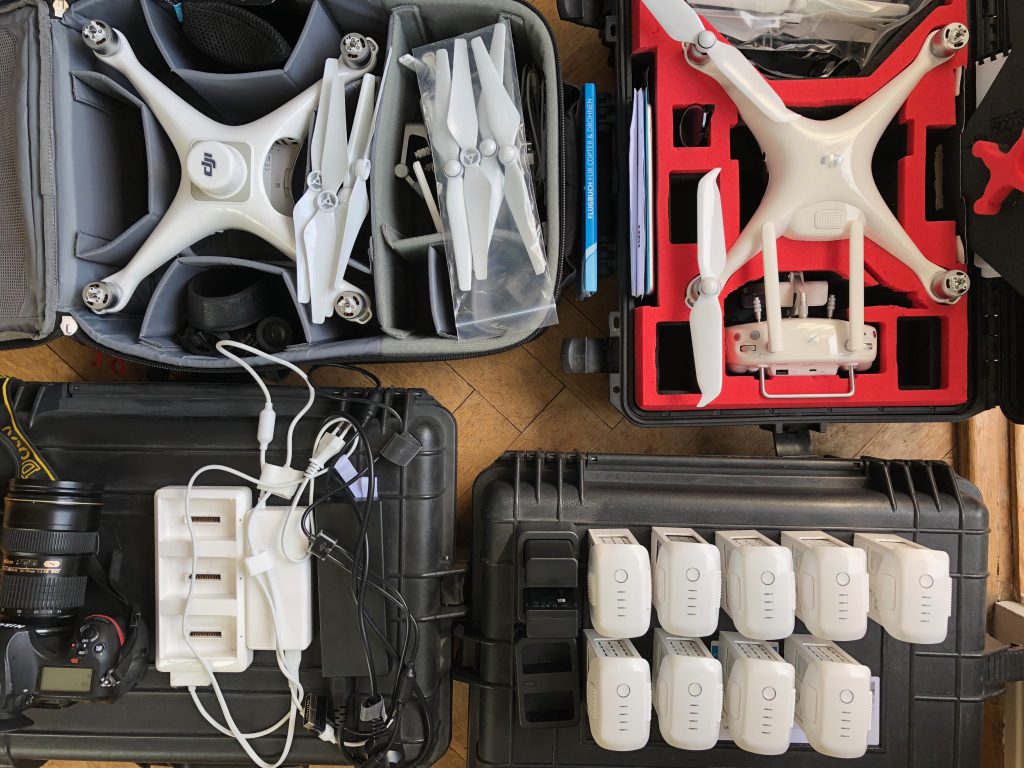
Here some recent figures from first test flights with the P4M. The system uses an iPad to do the App controlled flight management. The mobile telecom card also sits in the iPad. Imo not an optimal solution. My first tests clearly revealed less good connection quality to the SAPOS server compared with the P4R solution (card installed in the Remote Control). In fact the best solution would be to have the card installed in the UAV since the SAPOS signal would be much easier to receive in 100 m altitude – but the flight times could be compromised – since the card reader and access needs to be installed than directly on the UAV hardware.
However flying the P4M is like flying the P4R – works kind of flawless. So far the only problems I encountered: missing or lost SAPOS connections, lost custom stick mode as an option in the firmware (please DJI: give it back!) and GSPro cannot connect to a mission that had to be paused due to low batteries.
The battery of the RC cannot be exchanged – the solution of the P4R is much better. Here you can easily change the power-supply in the field. This isnt possible anymore with the P4M.
mtk
January 2020:
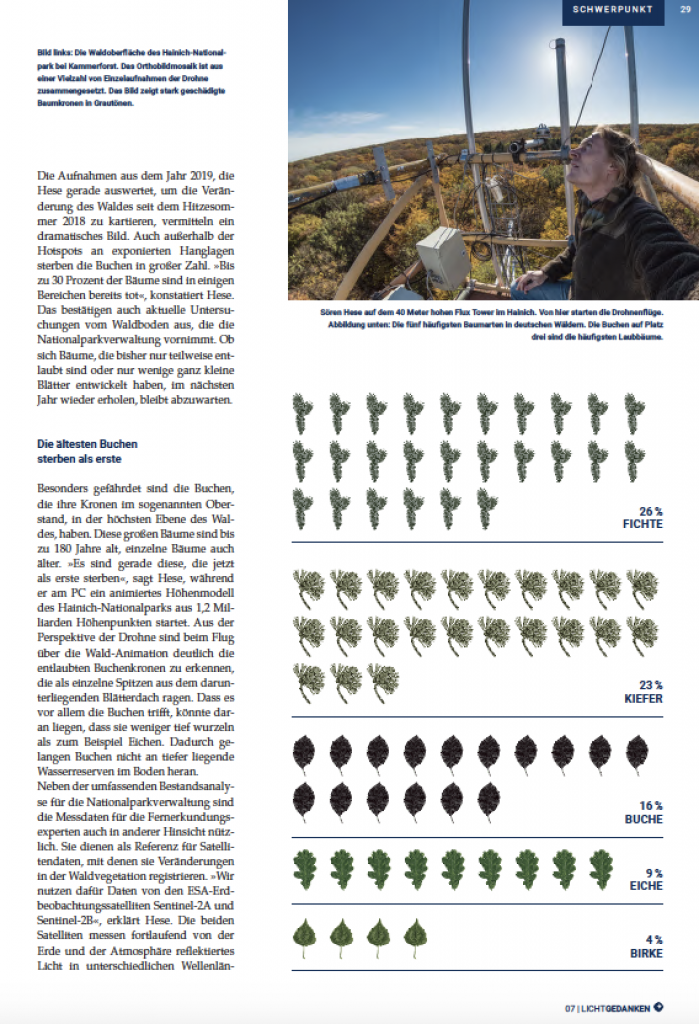
A short article about our work in the Hainich National Park area on the beech degradation analysis appeared in the Journal of the Friedrich-Schiller-University Jena “Lichtgedanken” in Edition 7. You can read the PDF version here:
or the HTML version here:
https://www.lichtgedanken.uni-jena.de/Ausgabe_07_Buchen_in_Not-path-140,5.html
There will be also an english language version soon.
October 2019:
Cold air and short illumination time frame – thats what dominated the flight campaign at the 31st of October 2019 in the Hainich National Park. Originally flights on all test sites were planned but this was hardly possible in this short time frame without enough light. So I covered the Huss area and the west Berka vdH site. Flying below 8 degrees °C from the flux tower turned out to be a very very cold experience. There was also a problem with the custom stick mode of the P4R appearing and it took some time to get this sorted out – not so nice in 40m height on an atmospheric gas measurement tower (I have a P4R support case open with DJI to sort this out, the custom stick mode will not save on exit. In fact it always resets to a totally useless stick mode config. Finally I switched to stick mode 3 since this is the closest to my usual stick mode, update: DJI confirms this as a firmware bug – it will be corrected with the next firmware update for the P4R – hopefully soon). Overall some other interesting observations: this year defoliation was much quicker than last year in the Hainich National Park area. We also had some very cold days in October but overall the coloring of the deciduous beech forests started earlier (and November last year was much warmer ;)).
The flight times per battery are clearly reduced with these air temperatures. It took two batteries to get the HUSS area covered with the P4R from 100m altitude, but this was also due to the higher than normal overlap for this flight (80/80) that I dialed in in order to compensate for the defoliated status of some trees. Image alignment and SfM processing is much easier with defoliated stands when image overlap is above 80%.
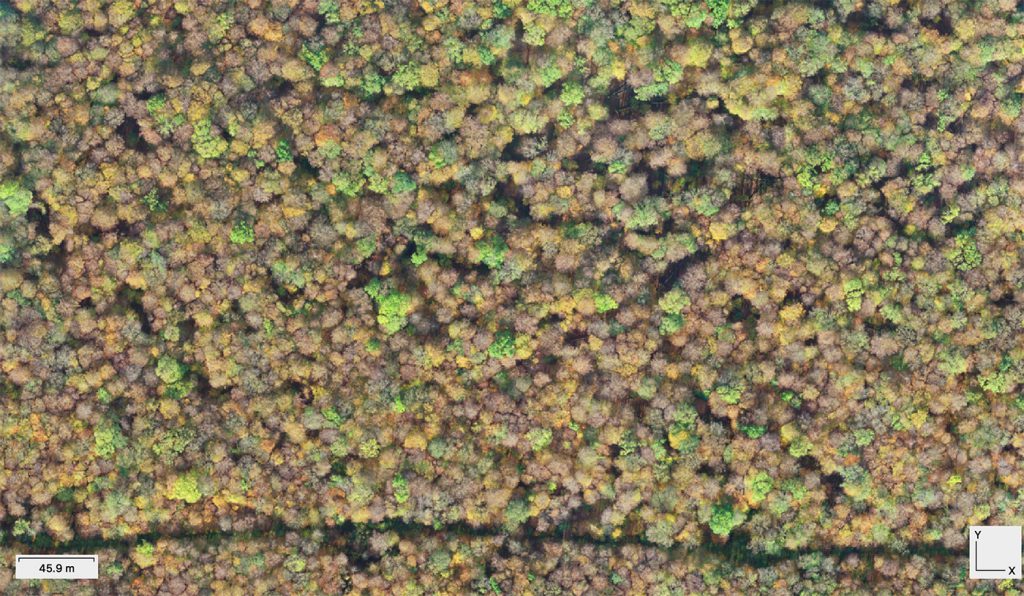
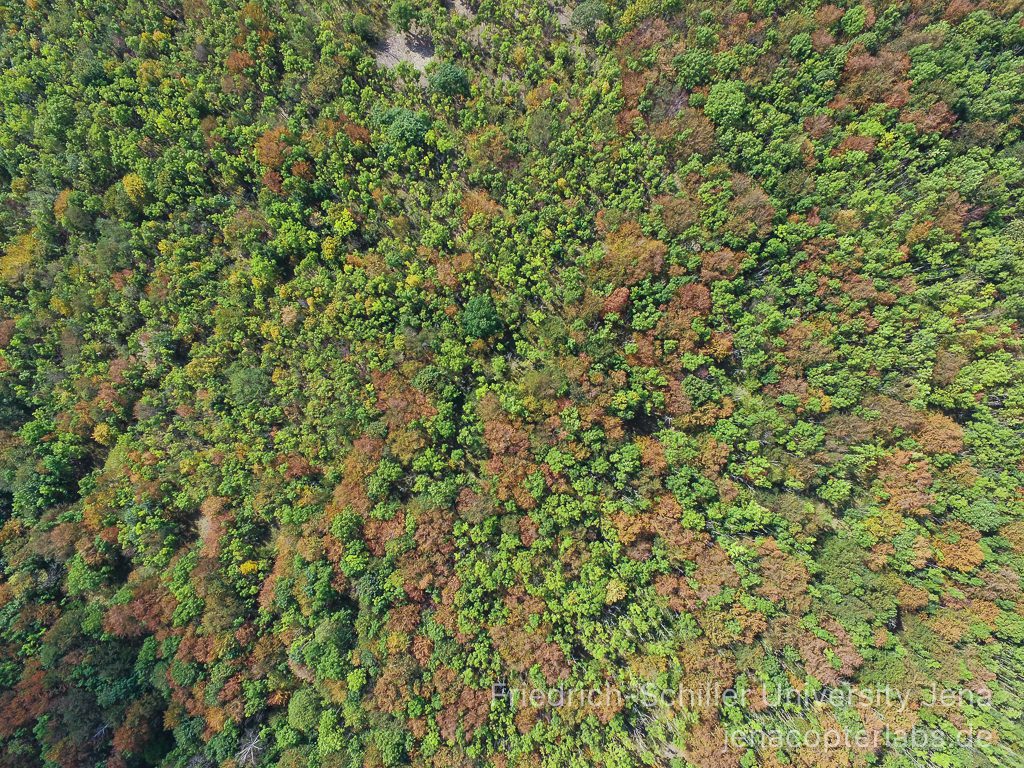
Main reason for this late Oct. flight campaign was to map some tree species that can be differentiated from the beech trees by late foliage coloring. This is important for the tree species reference data definition that we need for classification of the full area CIR airborne ortho mosaics for beech mortality mapping in 2019. Ash trees and maple trees show yellowish to green leave colors while the beech is mainly fully defoliated now. Only few of the understorey beech trees still show golden-brownish coloring.
mtk – first results of the species discrimination from multiseasonal RTK data sets will be shown on the DLR meeting in November 2019 in Cologne.

.
Planning for 2020 started. We will monitor how and where the beech trees wake up and come back in March/April/May 2020 with lots of gear and hopefully also with the P4MS that is right now in the ordering pipe.
29th of September:
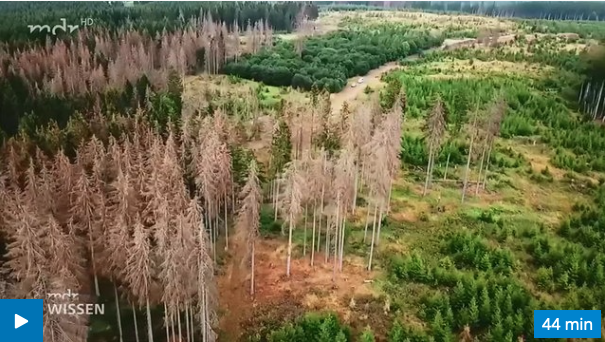
A nice MDR Wissen Doku has been published with contributions from our Hainich National Park beech declining mapping project. We explain some of the concepts how we use copter technology to analyze Sentinel-2 satellite data of the forest decline in the Hainich forest region.
https://www.mdr.de/video/mdr-videos/d/video-338706.html
August 2019:
Since July we have been very active covering the forest change in the Hainich National park region using the Phantom 4 Pro copter and the new Phantom 4 RTK (P4R). A project in cooperation with the Hainich national park administration, ThüringenForst and DLR Institute for Data Science Jena. First flights over 5 test areas were done already in July. We also started investigating Sentinel-2 L2A data for Thuringia. Now end of August we repeated the flights with the new Phantom 4 RTK copter system and mapped the same area again covering 400 ha. The time series signal from Sentinel-2 data for the Hainich forest region shows clearly a declining trend. The dry period this summer triggered the dying of beech trees in the park region that have been already under stress in summer 2018 and the remaining beech trees now change the foliage color quickly – much faster than in previous years. The full Sentinel-2 time series comparison (2019 vers. 2018 at the end of October/November 2019 will likely reveal this more clearly. More copter flights will follow in September and October. The change in August is however already mixed with the phenological change and its not possible anymore to deduce a vitality status.
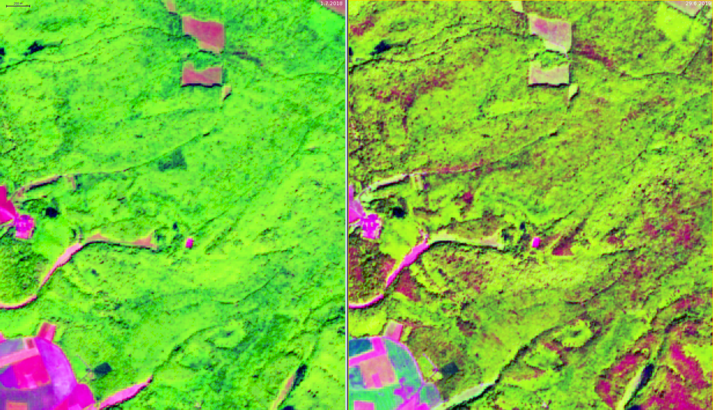
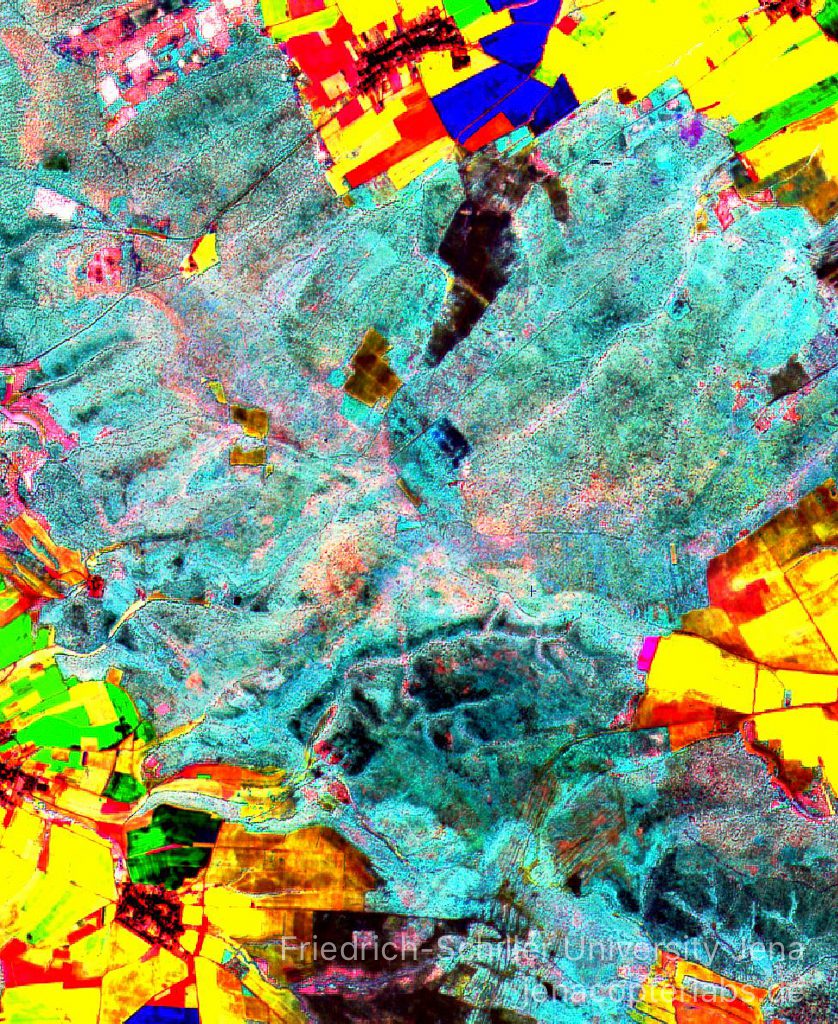
Looking at some Sentinel-2 reflectances from 2018 and 2019 we can easily see the change within the time series. The DWSI (Disease Water Stress Index) shows a clear trend (Gr. Zimmerberg/Hainich National Park):
DWSI 2018: 20.4.2018: 1.20 9.6.2018: 2.29 23.8.2018: 1.79
DWSI 2019: 17.4.2019: 0.71 4.6.2019: 1.35 25.8.2018: 1.09
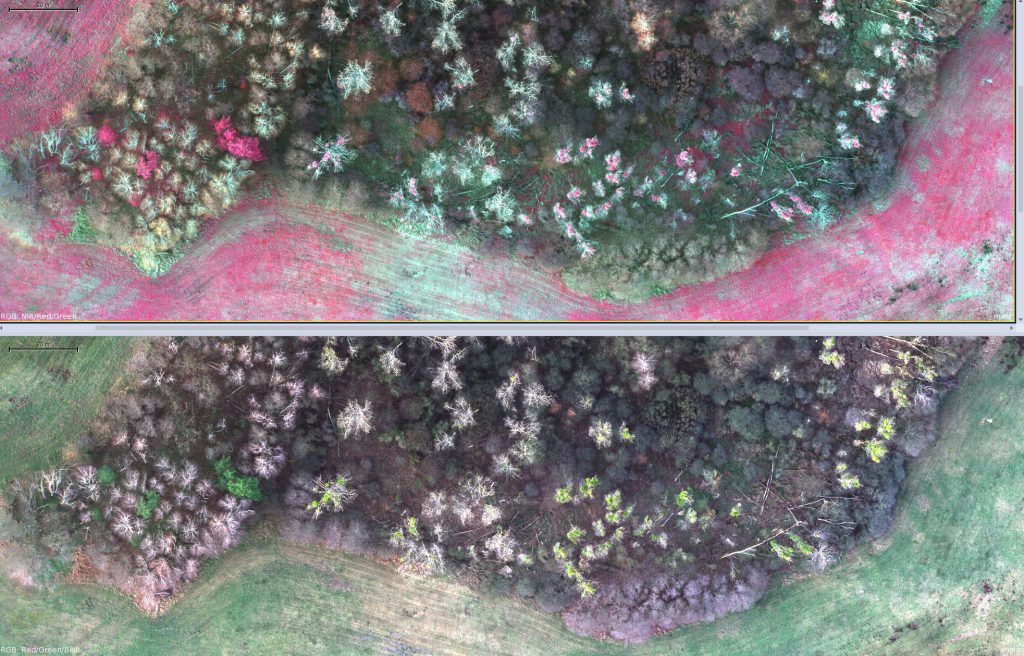
Thats also what we can see in multitemporal ratio RGBs comparing this spatially more explicit: in some regions the August 2019 DWSI is not even reaching the values of April 2018 (although in August phenology is changing the reflectance quickly):
First results from our second flight campaign at the 31st of August 2019 now show more trees effected in the western part of the Hainich region (compared to early July), the eastern region is partly more stable. The central area with the Huss area clearly now shows more variability than in July – indicating also phenological changes due to the start of the foliage coloring of the beeches now.
We also mapped 300 ha of maize fields to investigate wild pig damages in the direct neighborhood of the national parc area – more to come on this topic/project later (a cooperation of FSU Jena, DLR Jena and NLPV Hainich as part of the wild boar research project).
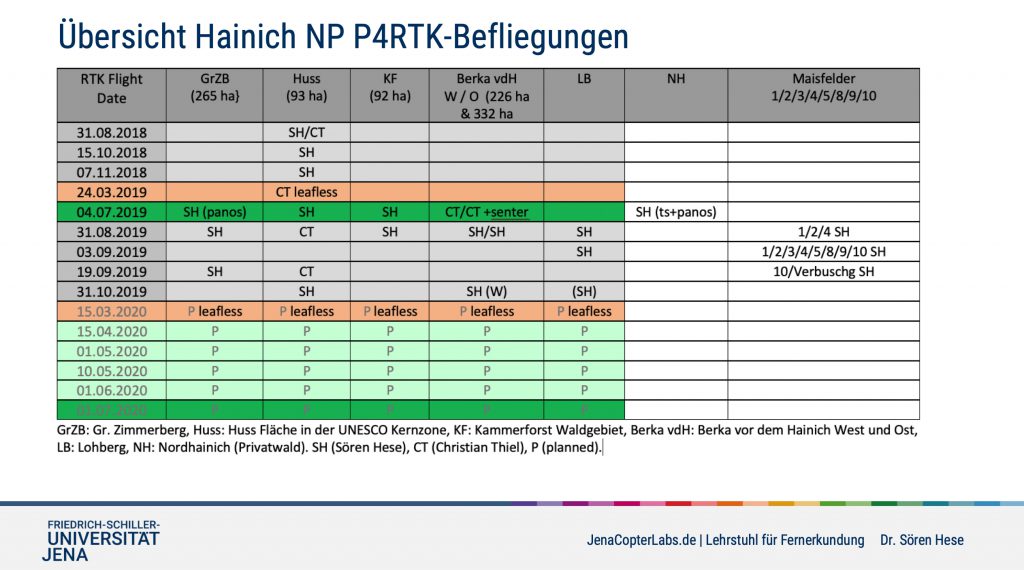
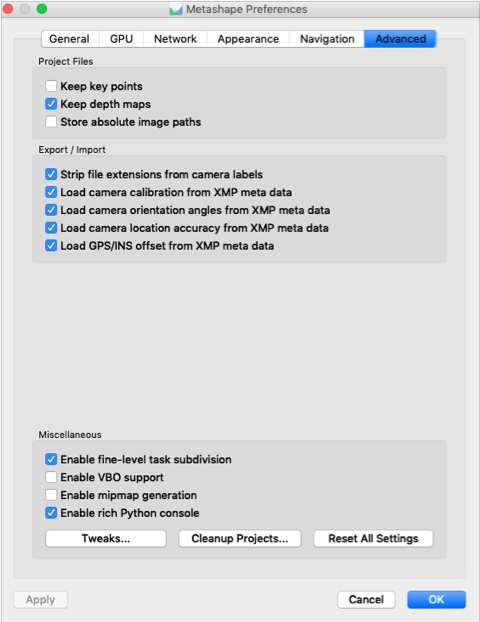
The new Phantom RTK system (Real Time Kinematic) receives a SAPOS correction signal via a mobile SIM card in real-time – the resulting geometric precision makes reference ground control points more/less unnecessary. The processed data products are more accurate georeferenced and repeating data acquisitions show much better absolut geometric fit. In forested regions using ground control points is often impossible. The RTK systems are the only solution to get better co-registration accuracy and to avoid the doming effect in SfM post processing since the image data is calibrated using the camera calibration metadata, the camera orientation angles, camera location accuracy and GPS/INS offset data that comes with xmp metadataset within every image (check figure below). (Nice read here: https://onlinelibrary.wiley.com/doi/epdf/10.1002/esp.3609). However – the RTK signal seems sometimes to get lost – the P4R than switches to standard GNSS for some time – this is likely due to a low quality 4G signal but it is not fully understood so far (mobil phones work like a charm at the same time wih LTE). You end up with a mix of GNSS and RTK measured positions. My first impressions in September are that these “GNSS images” are sometimes a problem in the alignment-step of the workflow.
The Phantom 4 RTK creates a “Survey” folder that holds a PPKRAW.bin file with sat observations and ephemeris data in RTCM3.2 format an EVENTLOG.bin file with the exposure time log file in bin format, and exposure time log file in ASCII format and a Rindex.obs file. So the P4RTK stores PPK data also for postprocessing. Also nice: ergonomics of the P4R: the controller battery is hot swap-able – there is a Chinese voice shouting that you have 3 minutes to exchange the controller battery when you work the batteries down to approx. 10 percent. That is very handy because the controller is indeed eating the batteries – likely due to the very bright display of the P4R-RC. The controller however clearly needs a firmware update – nobody only some understand/s the Chinese lady – it should be also repeated in English ;).
The UAV flight campaigns and the derived datasets (very detailed point cloud files, digital surface models and RGB ortho mosaics) will serve as reference data for the Sentinel-2 time series analysis in 2019 – we can directly link changes in canopy structure to the changing signal of the Sentinel-2 spectral signatures. This data is also used by the national parc administration to quantify the amount of beech trees that are effected. End of August however the weather conditions now change and cloud free coverage for S2 data is getting more unlikely.
July 2019:
Since July 2019 we have been very active covering the forest change in the Hainich National parc region using the Phantom 4 Pro copter and the new Phantom 4 RTK (P4R). A project in cooperation with the Hainich national parc administration, ThüringenForst and DLR Institute for Data Science Jena. First flights over 5 test areas were done already in July. We also started investigating Sentinel-2 L2A data for Thuringia. Now end of August we repeated the flights with the new Phantom 4 RTK copter system and mapped the same area again covering 400 ha. The time series signal from Sentinel-2 data for the Hainich forest region shows a declining trend. The dry period this summer triggered the dying of beech trees in the park region that have been already under stress in summer 2018 and the remaining beech trees now change the foliage color quickly – much faster than in previous years. The full Sentinel-2 time series comparison (2019 vers. 2018 at the end of October/November 2019 will likely reveal this more clearly. More copter flights will follow in September and October.
First results from our second flight campaign at the 31st of August 2019 now show more trees effected in the western part of the Hainich region (compared to early July), the eastern region is partly more stable. The central area with the Huss area clearly now shows more variability than in July – indicating also phenological changes due to the start of the foliage coloring of the beeches now.
The new Phantom RTK system (Real Time Kinematic) receives a SAPOS correction signal via a mobile SIM card in real-time – the resulting geometric precision makes reference ground control points more/less unnecessary. The processed data products are more accurate georeferenced and repeating data acquisitions show much better absolut geometric fit. In forested regions using ground control points is often impossible. The RTK systems are the only solution to get better co-registration accuracy and to avoid the doming effect in SfM post processing since the image data is calibrated using the camera calibration metadata, the camera orientation angles, camera location accuracy and GPS/INS offset data that comes with xmp metadataset within every image (check figure below). (Nice read here: https://onlinelibrary.wiley.com/doi/epdf/10.1002/esp.3609). However – the RTK signal seems sometimes to get lost – the P4R than switches to standard GNSS for some time – this is likely due to a low quality 4G signal but it is not fully understood so far (mobil phones work like a charm at the same time wih LTE). You end up with a mix of GNSS and RTK measured position. My first impressions in September are that these “GNSS images” are sometimes a problem in the alignment-step of the workflow.
The RTK Phantom 4 RTK creates a “Survey” folder that holds a PPKRAW.bin file with sat observations and ephemeris data in RTCM3.2 format an EVENTLOG.bin file with the exposure time log file in bin format, and exposure time log file in ASCII format and a Rindex.obs file. So the P4RTK stores PPK data also for postprocessing. Also nice: ergonomics of the P4R: the controller battery is hot swap-able – there is a Chinese voice shouting that you have 3 minutes to exchange the controller battery when you work the batteries down to approx. 10 percent. That is very handy because the controller is indeed eating the batteries – likely due to the very bright display of the P4R-RC. The controller however clearly needs a firmware update – nobody only some understand/s the Chinese lady – it should be also repeated in English ;).
The UAV flight campaigns and the derived datasets (very detailed point cloud files, digital surface models and RGB ortho mosaics) will serve as reference data for the Sentinel-2 time series analysis in 2019 – we can directly link changes in canopy structure to the changing signal of the Sentinel-2 spectral signatures. This data is also used by the national parc administration to quantify the amount of beech trees that are effected. End of August however the weather conditions now change and cloud free coverage for S2 data is getting more unlikely.
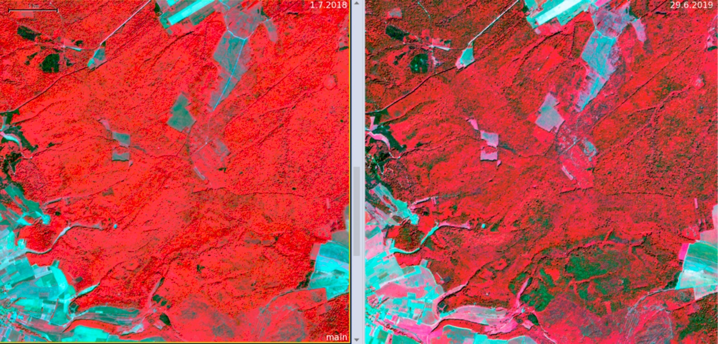
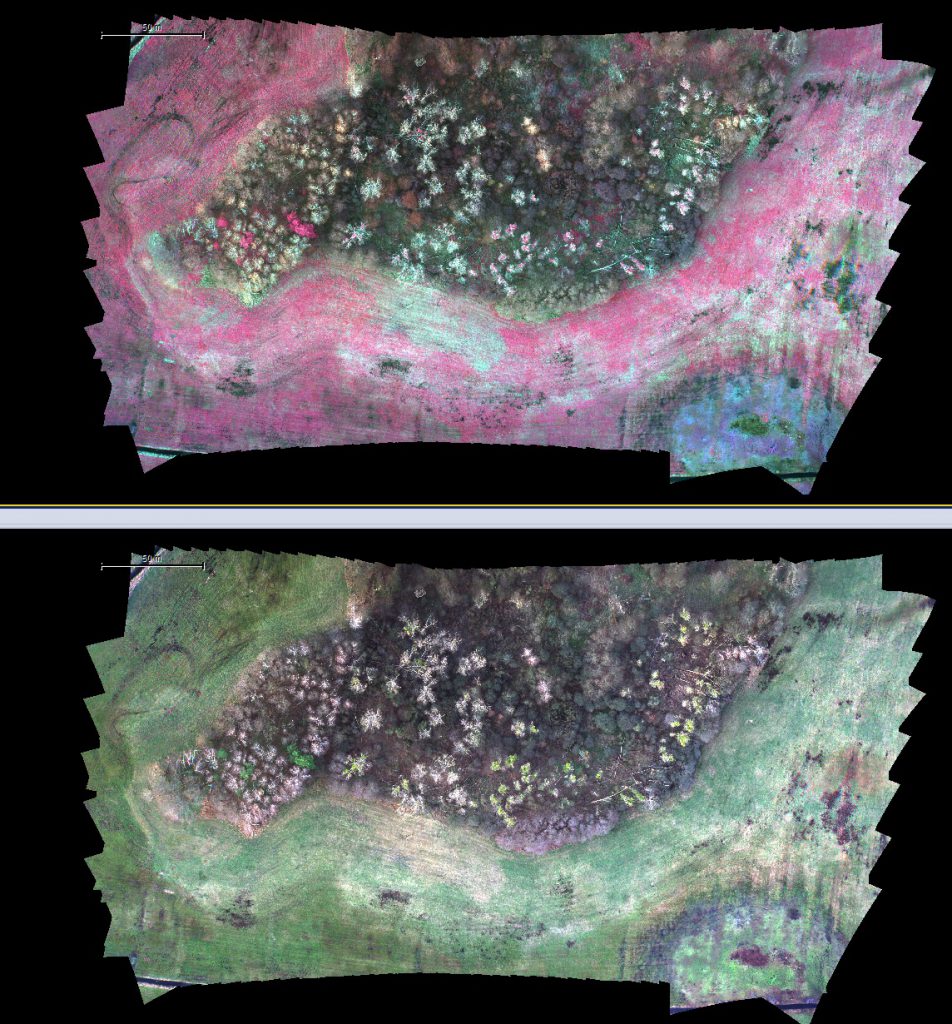
Comparison with Sentinel 2 data clearly shows that the reflectance change in comparison to summer 2018 is caused by partly defoliated tree crowns, dead or defoliated tree crowns. Some trees only show a reduced foliage and there is indication that some more trees will be affected in this summer period in August/September.